Every month, the Australian Industry Group Australian Performance of Manufacturing Index reveals what the landscape of Australian manufacturing looks like across a variety of industries and sectors. The data, compiled from information provided by various companies involved in manufacturing around the country, asking them if they have seen any growth or reduction in the following aspects of their operations:
- Production Levels
- Employment Levels
- New Orders
- Exports (If Applicable)
- Stocks of Finished Products
- Deliveries of Raw Materials
- Cost of Raw Materials
- Sales Levels
- Average Selling Prices
- Average Wages
This data is then compiled for distribution around the industry. It’s a valuable insight into how each aspect of the manufacturing industry is faring, as upturns in one area can have a direct impact other markets in the following months. For example, a sharp increase in new orders for mining equipment can result in more equipment maintenance orders down the track.
August 2018 results
The August report shows an overall growth by 4.7 points to 56.7 points from last month’s report. A result of 50 points in any sector is an indicator of expansion, with larger numbers suggesting faster than expected expansion. This positive indicator for August shows that the country continues its positive swing, a run it has enjoyed for one month short of two years consecutively. Every one of the seven activity sub-indexes, including sales, new orders and exports, measured in the Australian PMI showed growth in August, so boom times are ahead for many industries.
The biggest cause for concern across the board is the drought conditions being felt in Queensland and New South Wales. It’s impacting the supply networks for food and beverage manufacturers in the area and consequently may force higher prices or lower demand in the future. This is also having a direct impact on manufacturers who supply the food and beverage industry with agricultural equipment, as a lower number of sales are being reported.
Sales, as a sub-index, however, is doing well pushing back against the comparatively diminutive July results. It increased by 15.2 points to reach an impressive 60.7 points for the month of August, which may be explained by normal activity resuming after the end of the financial year.
On average, the wages sub-index saw a slight rise in August, going up 4.1 points to a new all-time high of 64.7 points. This data tells us that wage increases are being approved across the manufacturing industry, as the country’s minimum wage has gone up in July.
Perhaps this money is needed to compensate for the rise in the manufacture selling price sub-index, which has risen 5.1 points to 58.1 points. This means that more and more manufactured products are costing more than they did a month ago.
Product categories examined
The products themselves are moving in interesting directions according to the report. For example, while food & beverages saw an increase there was a general downturn in Textiles, Clothing, Furniture & Other. That area fell a further 1.4 points from the previous month to reach a low of 43.7 points. Increasing competition in the market has seen prices fall considerably.
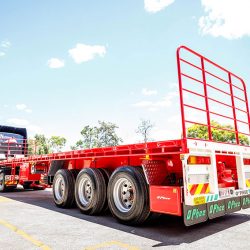
Machinery & Equipment fell ever slightly by exactly 1 point to 55.4 points. This sector, which covers mining equipment and heavy haulage trailers among other non-car items, continues to see strong demand.
At The Drake Group, we continue to be a proud member of the Australian manufacturing industry, and we look forward to seeing what future months bring to our customers. Contract The Drake Group today to talk to us about our, engineering services, collectible models and range of heavy haulage trailers all manufactured here locally in Brisbane.